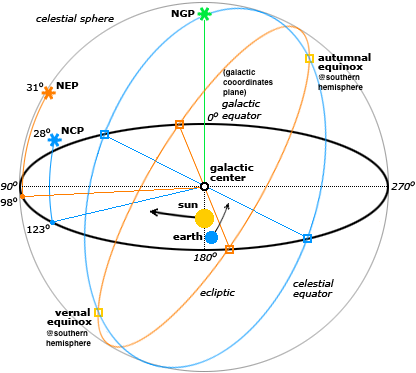
Subband Statistics (SST)
Subband statistics involve the analysis of data within specific frequency subbands. LOFAR’s observational frequency range is divided into numerous subbands, each covering a narrow segment of the spectrum.
For example, a typical LOFAR LBA array contains 96 dual-polarized antennas. Each polarization unit records antenna feedback from 0-100 MHz. As shown in the figure below, we present the SST data for a LBA antenna array with 192 polarized signals. In the figure, we can see that most of the spectral data is relatively concentrated, and only a small portion of the data is abnormal, which indicate the antenna is either broken or down.
This SST data allows for detailed spectral analysis and aids in distinguishing between different types of signals.
Application
Spectral Analysis: By examining the data within each subband, astronomers and engineers can identify the distribution of signals across different frequencies, which is crucial for understanding the spectral characteristics of various astronomical sources.
Noise Evaluation: SST help in assessing and mitigating noise levels within specific frequency ranges, enhancing the overall quality of the signal.
Quality Control: Analyzing subband data allows for the detection and correction of anomalies or distortions, ensuring that the data used for further analysis is accurate and reliable.
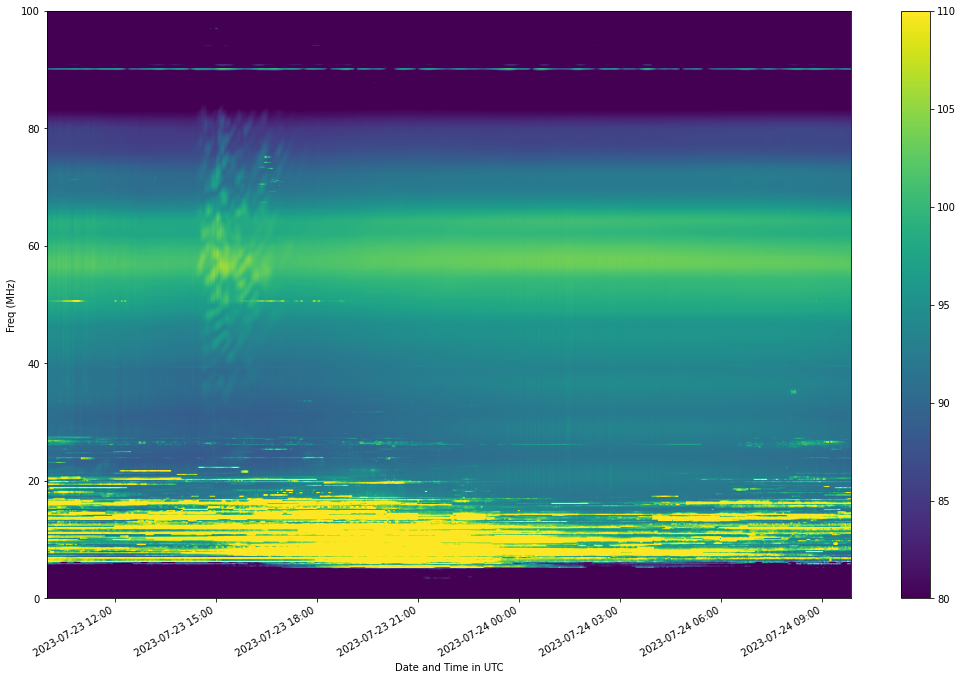
Beamlet Statistics (BST)
Beamlet statistics refer to the analysis of data collected through multiple small beams formed using beamforming techniques. LOFAR employs phased array technology to combine signals from different antennas to create these narrow directional beams, known as beamlets.
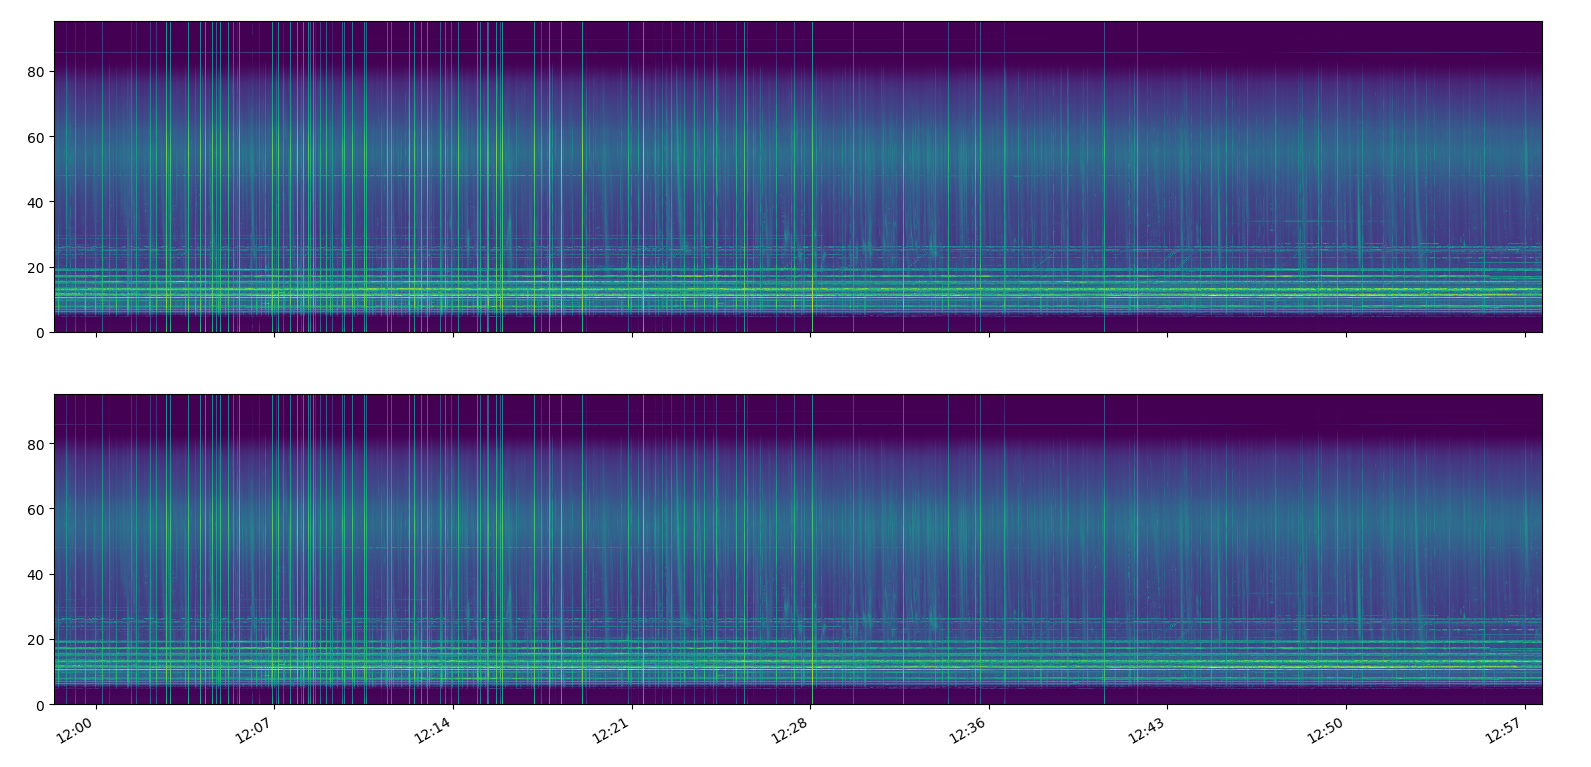
The following image shows the BST data image of the LOFAR LBA antenna pointing toward the sun. In the figure around 15:00, we can see solar storms in the 40-80 MHz range.
Applications
- Directional Analysis:: Each beamlet points in a different direction in the sky. By analyzing data from various beamlets, scientists can map the spatial distribution of signals, identifying the direction and location of astronomical sources.
- Signal Enhancement:: Beamlet statistics enable the detection and amplification of signals from specific directions while suppressing interference from other directions, thus improving the clarity and strength of the observed signals.
- Source Localization:: By combining data from multiple beamlets, researchers can accurately pinpoint the position of astronomical events or sources, aiding in their detailed study.
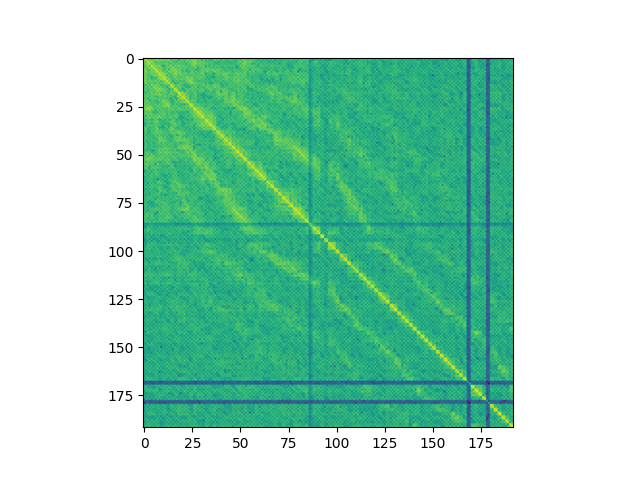
Crosslet Statistics (xst)
Crosslet statistics involve the analysis of cross-correlation data between different antenna pairs. Cross-correlation is a fundamental technique in radio interferometry, which LOFAR uses to achieve high spatial resolution and sensitivity by measuring the phase differences between signals received at different antennas.
The figure below, shows the image data of the XST data of the LBA with the X and Y axes for the X and Y polarization of the antenna, respectively. The yellow diagonal lines in the figure represent the autocorrelation results for the XX and YY polarizations of the antenna.
Applicationts
- Interferometric Imaging: Crosslet statistics are crucial for reconstructing high-resolution images of astronomical objects. By analyzing the cross-correlated data, scientists can generate detailed maps of the observed sky.
- Phase Calibration: This involves the analysis of phase differences between signals from different antennas. Accurate phase calibration is essential for correcting errors caused by instrumental and atmospheric effects, ensuring the precision of the interferometric measurements.
- Data Integration: Crosslet statistics facilitate the integration of data from multiple antennas, enhancing the overall signal quality and enabling the detection of faint astronomical sources that might be missed by individual antennas.
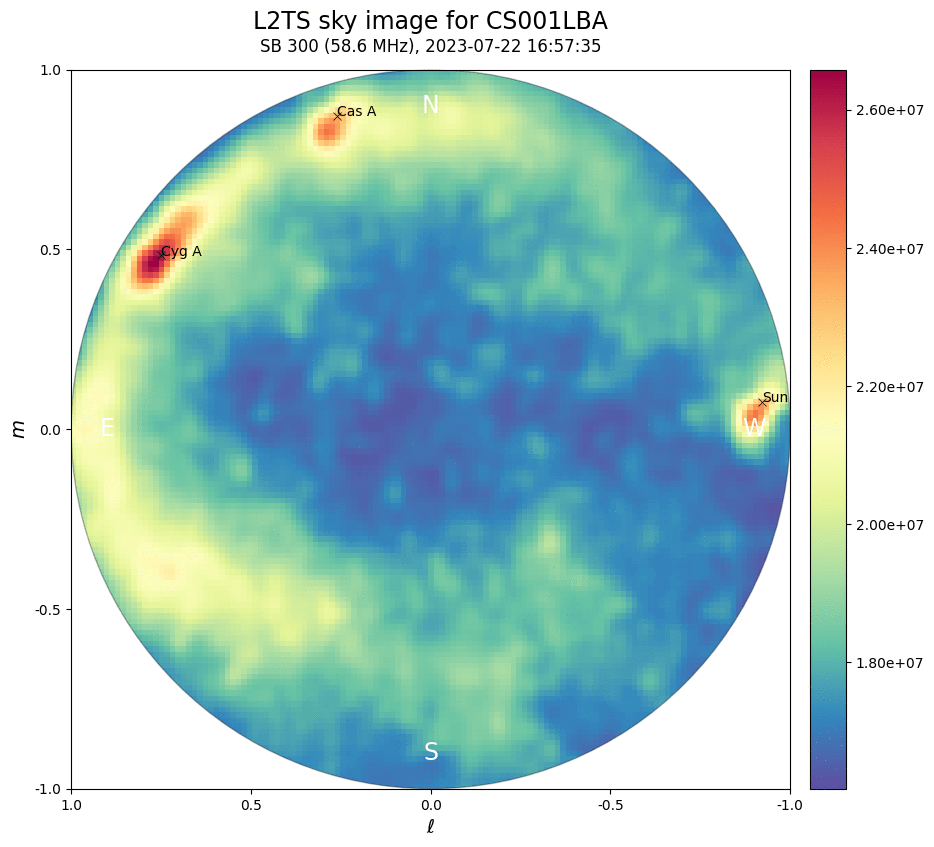
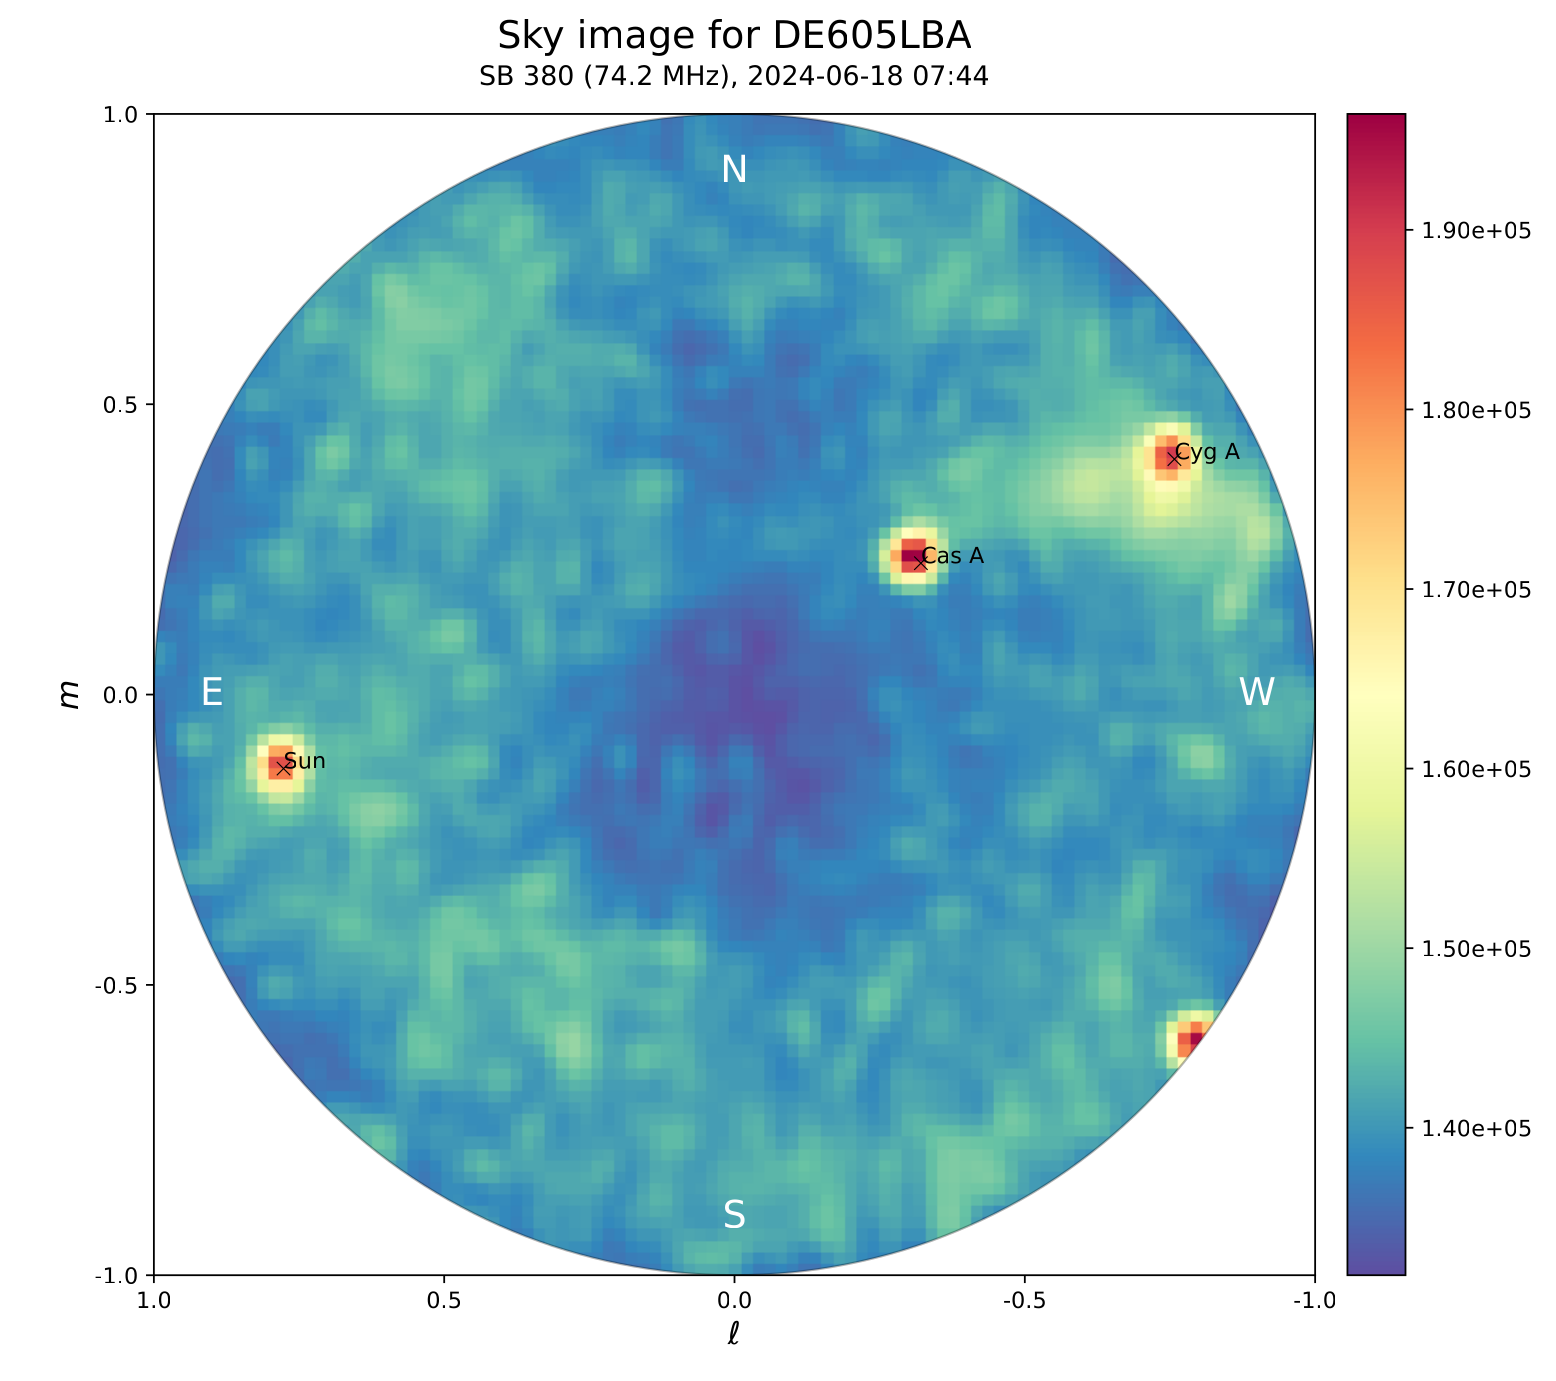 Fig 1 Fig 1
|
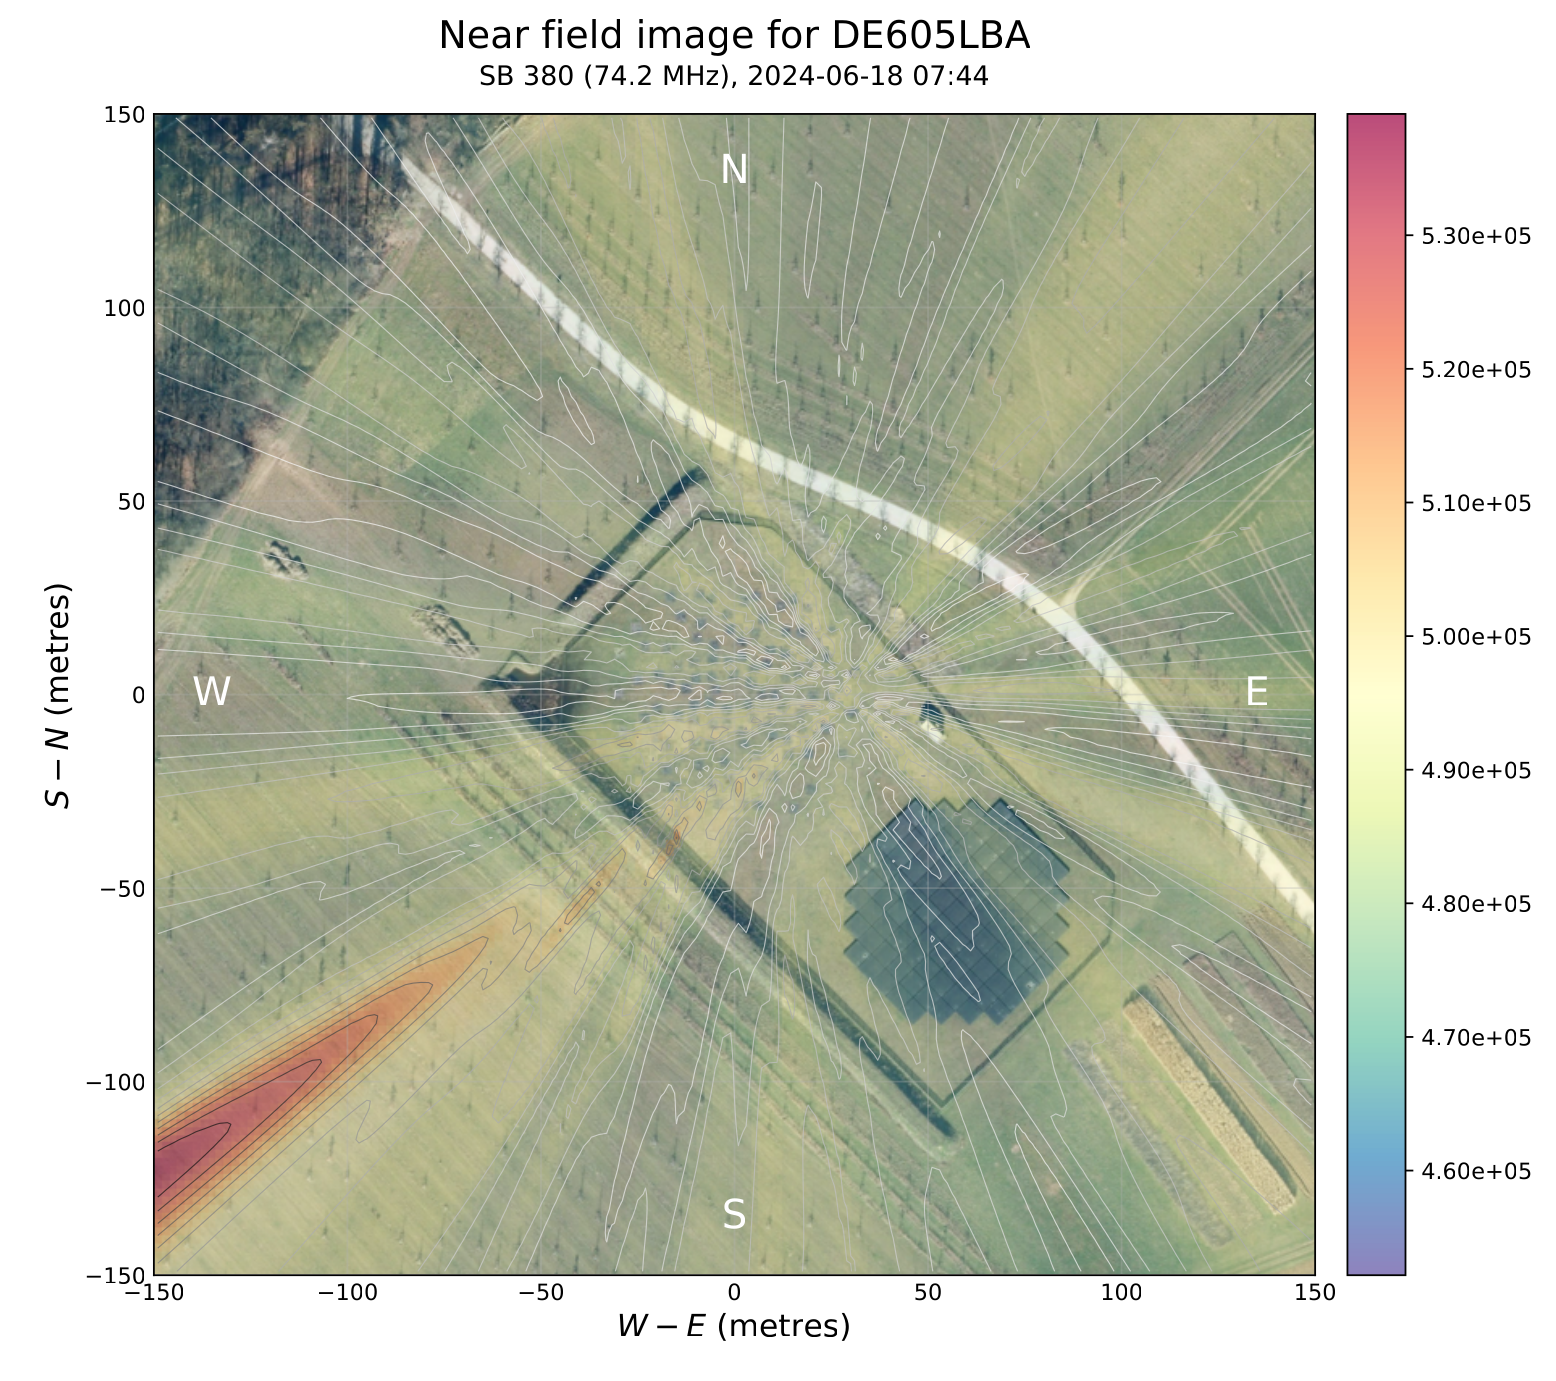 Fig 3 Fig 3
|
Extra interesting plots
Lightning
LOFAR is the first instrument capable of revealing the meter-scale physics that drives all fundamental lightning processes. The left picture below shows sky images of lightning phenomena, while the right picture presents BST of lighting recorded.
 Lightning sky image Lightning sky image
|
 Lightning BST Lightning BST
|
Jupiter Burst
In 1955, Bernard Burke and Kenneth Franklin discovered that Jupiter emits bursts of radio waves at a frequency of 22.2 MHz. The period of these bursts matched the rotation of the planet, and they used this information to determine a more precise value for Jupiter’s rotation rate.
This kind of burst is influenced by the interaction of Jupiter’s moon Io with Jupiter’s magnetic field.
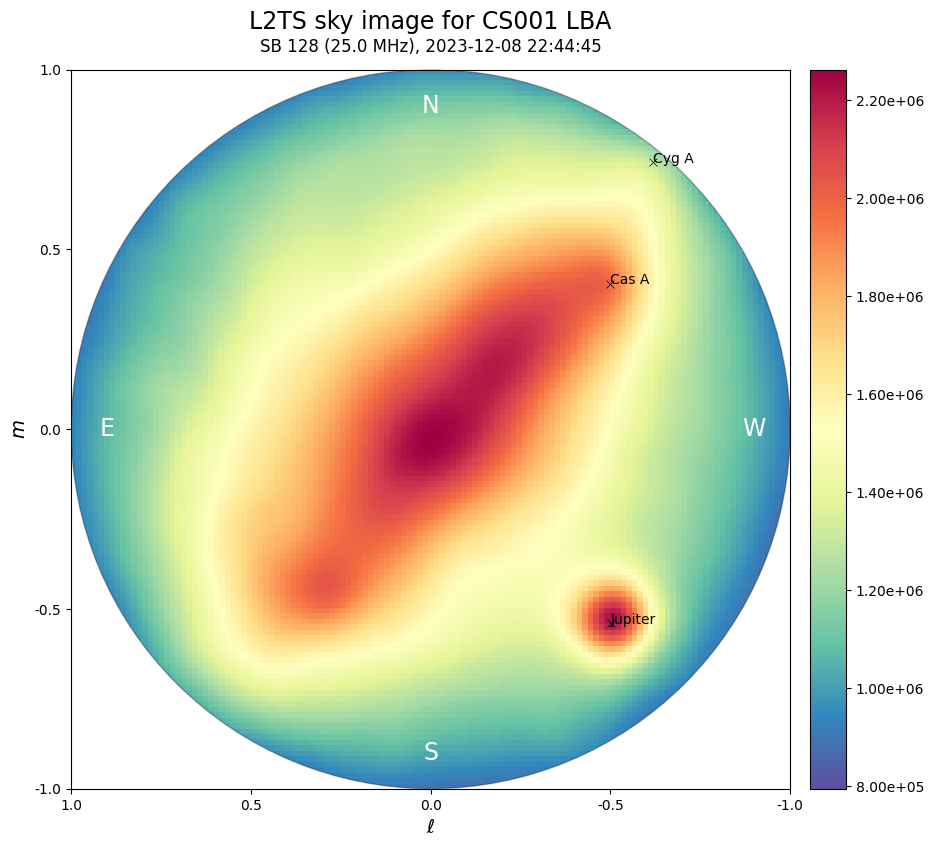 Jupiter sky image Jupiter sky image
|
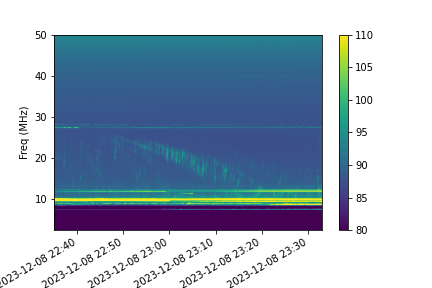 Jupiter BST Jupiter BST
|